GPT-4o It not only has powerful natural language processing capabilities, but can also be applied toData analysis, helping you to discover the hidden value in the data.
So, how can we use GPT-4o to perform data analysis to make business decisions more informed and forward-looking?
Understanding GPT-4o’s capabilities
Before you start using GPT-4o, it is important to understand its features, which is crucial during the data analysis and extraction process. Here are the main features of GPT-4o.
Natural Language Understanding:Explain queries and instructions in everyday language.
Text Generation:Provides detailed explanations and insights.
Pattern Recognition:Identify data patterns in text descriptions.
Basic calculation:Perform simple mathematical operations.
Summarize:Condense data results into a coherent summary.
Data formatting:Convert the data into the desired format, such as a table or list.
With these simple functions in mind, you’ll know when to use GPT-4o on your data.
Prepare the data
Before using GPT-4o for data analysis, you must first prepare the data file and make sure your data is error-free and in a consistent format.
The data should be structured and organized in a way that is easy to describe (e.g., tables, lists), and should be as easy to paste into the conversation as text or in a simple format.
GPT-4o accepts formats such as text (such as plain text descriptions), lists, CSV, TSV, or other formatted table files. It can also parse JSON files such as structured JSON data.
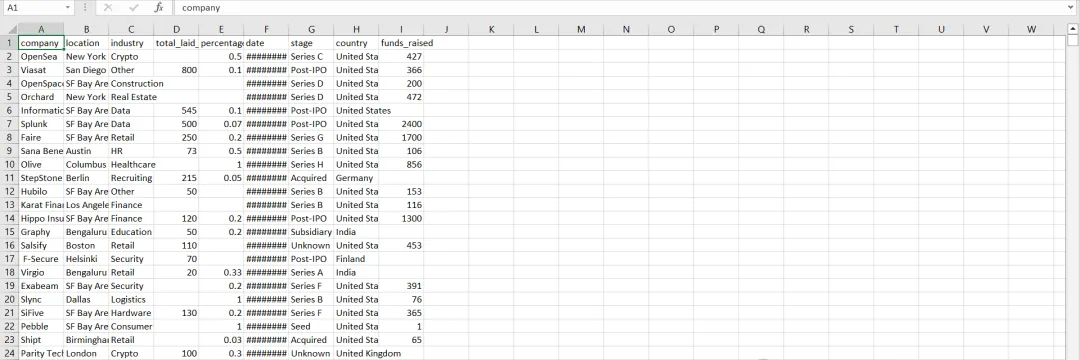
In my test, I downloaded a CSV file from the web that shows raw data on COVID-19 employee layoffs from 2019 to 2022. It was a very large file with over 3,000 rows.
Ask a question
Now that the data is ready, you need to prepare questions. Questions are what you want GPT-4o to do with your data. You can ask a variety of questions based on your needs, such as descriptive analysis, predictive analysis, data visualization, data processing, and even statistical analysis.
Let’s go through each of these steps one by one!
Descriptive analysis
Here, I uploaded the CSV file to GPT-4o and asked it the following questions.
"This is a CSV file containing employee layoff data from 2019 to 2022. Please summarize the main trends in this data."
In just a few seconds, GPT-4o provides a detailed summary of employee layoff data, such as overall layoff trends, geographic trends, layoff trend summaries, and even more.
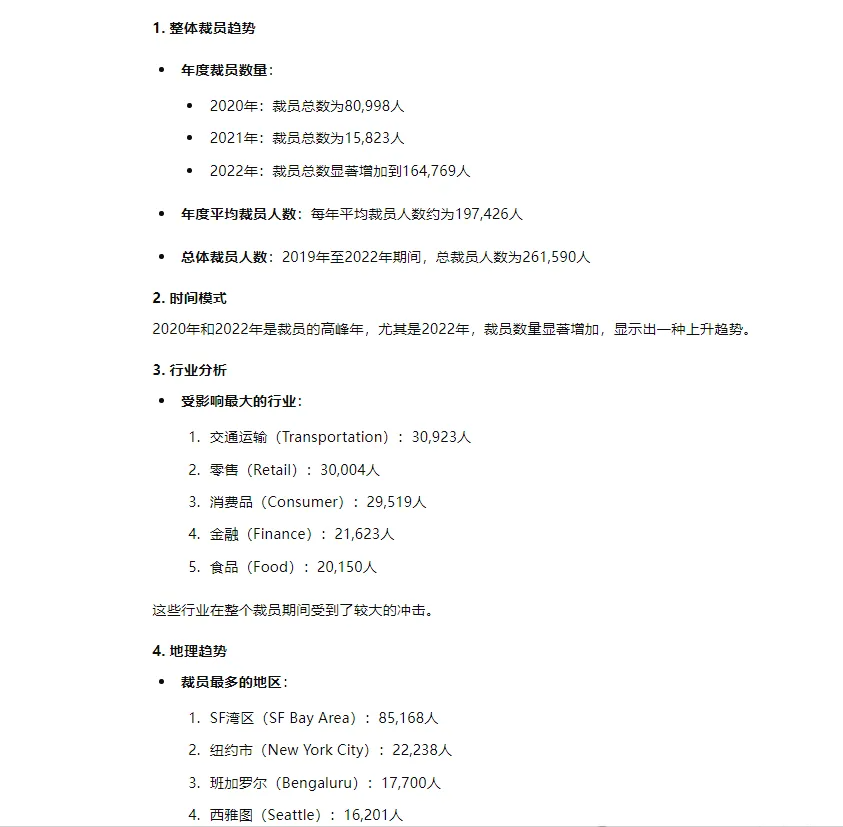
Overall, GPT-4o is able to give you a comprehensive data summary and provide detailed information on every aspect of your data file. If your data contains annual numbers, it can even extract annual trends, such as sales and year-over-year changes.
Predictive Analytics
After extracting valuable trends and insights from the data files, you can ask GPT-4o to perform predictive analysis based on these trends. For example, you can give GPT-4o a prompt like this.
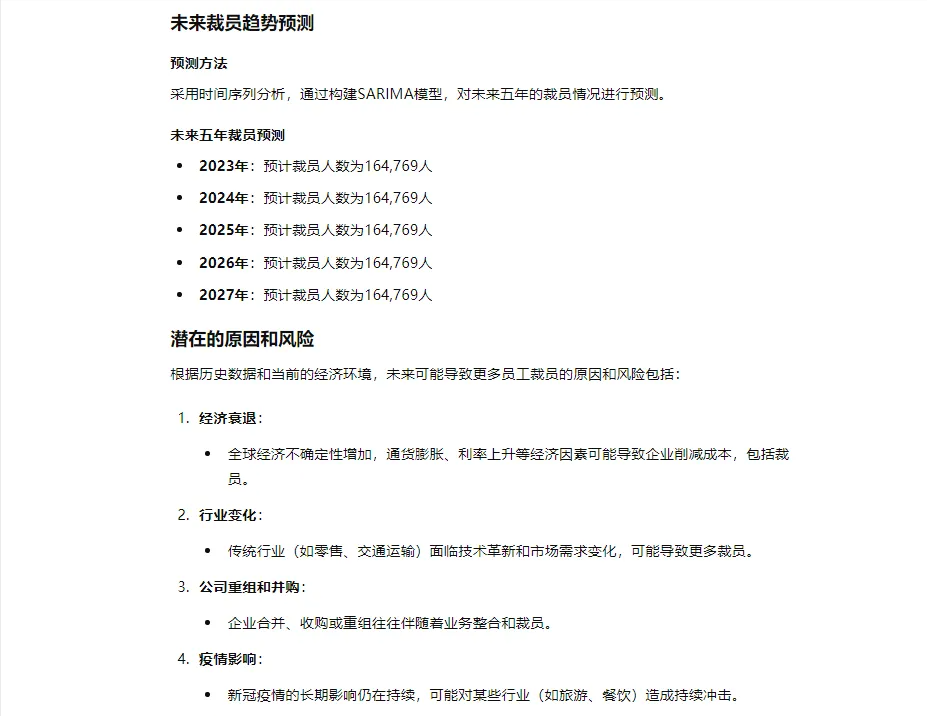
"Now that you've summarized the main trends in this data file, what can we infer about future layoffs based on this historical data?"
GPT-4o will analyze in detail the growth trend of layoffs in the next few years. It even predicts future layoffs based on the data files provided, pointing out the reasons and risks that may lead to more employee layoffs in the future.
Now that I have the forecast trend, I want to use a line chart to show the growth of recession data in the next few years until 2028. This is the prompt I gave to GPT-4o.
"Based on the trends shown in the layoff data, which show an increasing trend in layoffs, can you provide a chart showing the increase in recessions in the next few years before 2028?"
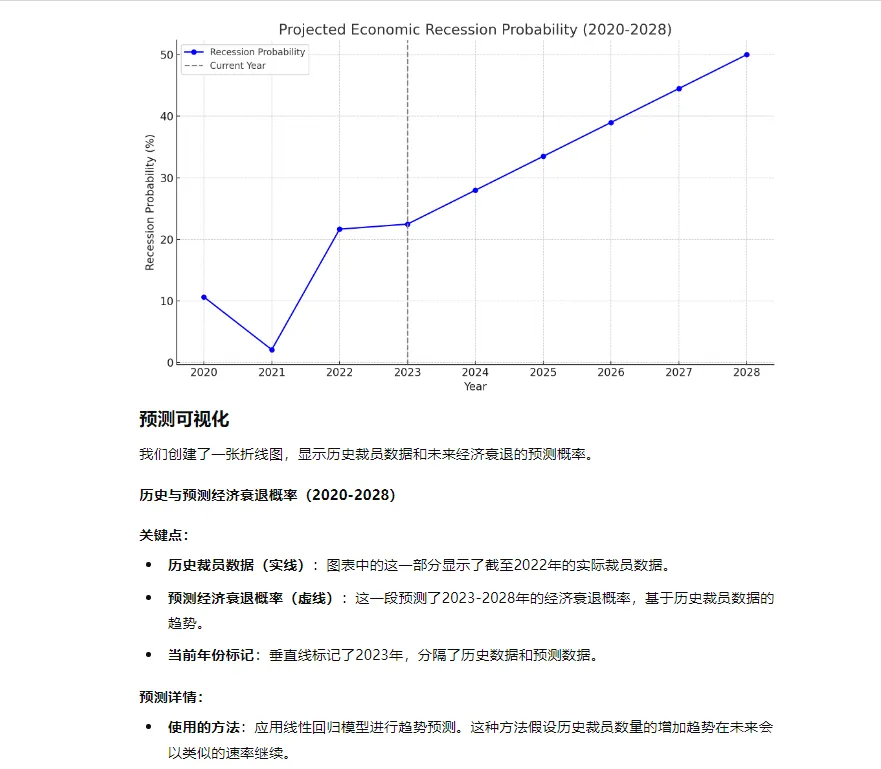
So you can see GPT-4o's ability to analyze the data, and the line chart that predicts layoffs for me in the next few years based on the data trends. And, it perfectly labels the chart for better understanding.
For GPT-4o, as long as the data files are properly classified, analysis and predictive analysis can be performed. Therefore, once GPT-4o summarizes key information from the data files, it can be asked to provide future insights.
Data Visualization
As you may know, ChatGPT can transform large amounts of table or Excel data into attractive graphical representations, or even pie charts. This is called data visualization, and it is a very important part of data analysis.
It’s not always possible to analyze huge amounts of data simply through numbers and theoretical descriptions. Let’s see how we can get GPT-4o to visualize the data so we can understand it better.
The layoffs data file I used included a lot of data on layoffs by company, layoffs by industry, and layoffs by region. Analyzing all of this data would be too tedious, so I asked GPT-4o to provide a pie chart showing the proportion of layoffs by industry. The prompt was as follows:
"I need you to visualize layoffs by industry in the form of a pie chart."
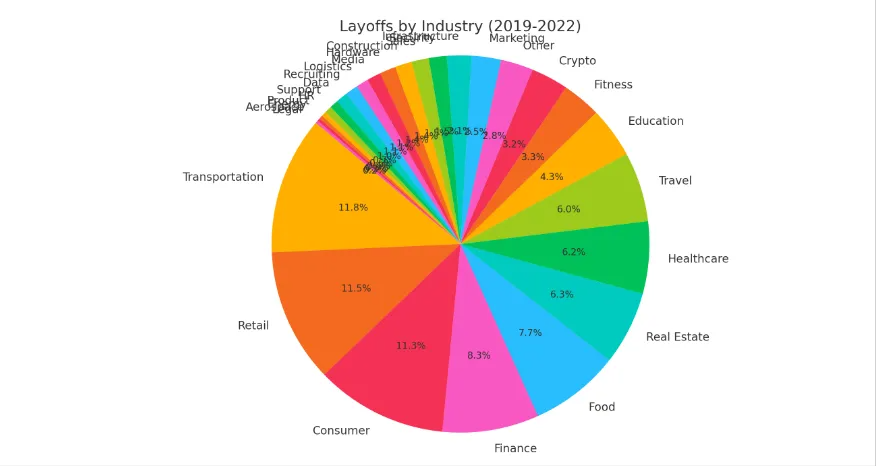
You can see that I got what I was looking for. A perfectly constructed pie chart showing the percentage of layoffs by industry made it much easier for me to analyze the data.
In short, you must first understand your data and find out whether the data is large enough to analyze with only theoretical facts and figures. If not, start by reading the data and finding out the main classification criteria.
The main classification criteria will help you to effectively divide the data into different groups and calculate the percentage of each group. For example, in the data above, I chose to group by industry. This allows us to more clearly see the percentage of layoffs in each industry.
Next, you can use GPT-4o to generate a pie chart, bar chart, or line chart based on this grouping standard (industry) to help you analyze the data more intuitively. Then you can start your analysis.
Data processing
GPT-4o can process and transform all your data into a new layout exactly as you want it.
For example, you can break a table into two separate tables, change the percentage composition of a pie chart, or even merge smaller bar charts to make them appear larger.
Here I have performed an operation to extract only 3 columns from the huge data file.
"Reformat the data file table to have only 3 columns, company, total_laid_off, and percentage_laid_off".
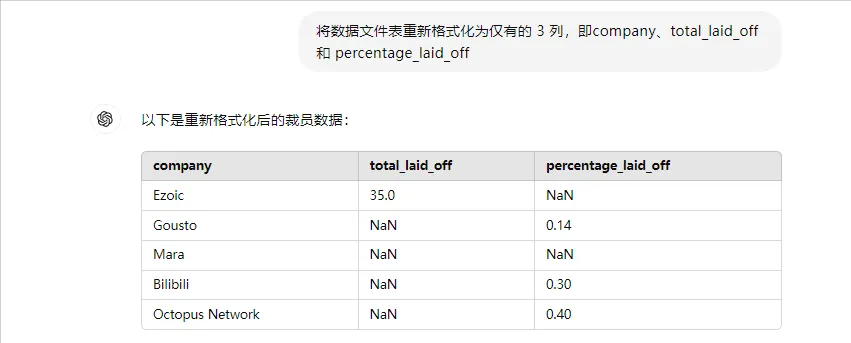
GPT-4o processed the previous data file exactly as I requested and generated a new table that not only contained the headers I wanted but also displayed some of the rows of data (only a few rows were shown because the original data file was very large).
You can upload your data in the form of a file and ask GPT-4o to process it in the way you want.
Statistical analysis
Finally, perform statistical analysis on the data file. The prompts are as follows:
"Based on the layoff data file, please calculate the mean, median and mode of the data file. If possible, also calculate the standard deviation."
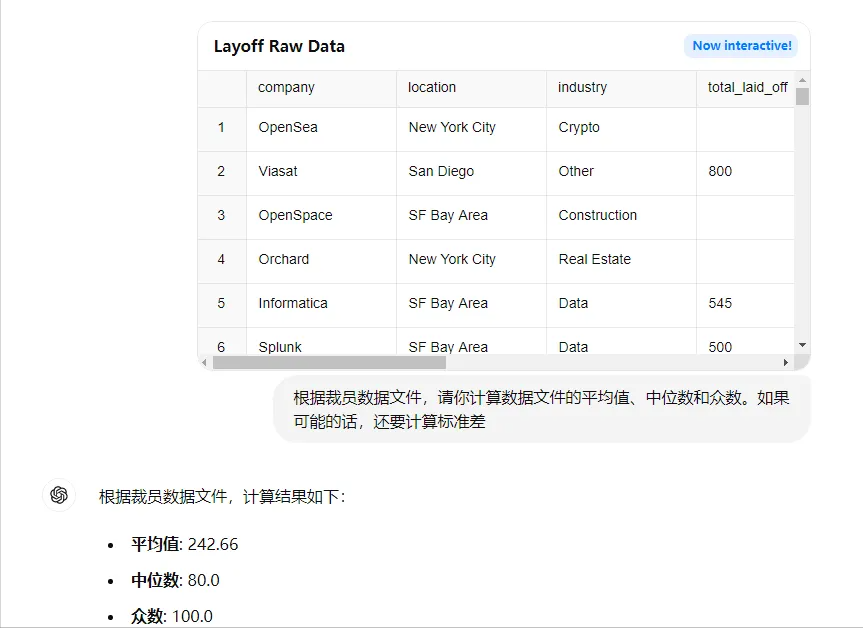
Whatever statistics are requested, GPT-4o delivers them quickly and efficiently. Even for such large and widely distributed data files, GPT-4o can quickly and accurately calculate the mean, median, mode, and even standard deviation.
It seems that the potential of GPT-4o is far from being fully realized!
Use GPT-4o and optimize your results
If you are not satisfied with GPT-4o’s initial results in the data analysis test, then you will need to make GPT-4o engage more deeply and provide better results by refining your questions or prompts.
You can make the prompt clearer and more detailed by providing more context or rephrasing the question. This will help GPT-4o better understand your needs.
Additionally, you can ask GPT-4o to provide more details or analyze the data from different perspectives to improve the results.
At the same time, you can also combine individual steps by breaking down complex analyses into simpler, more sequential steps.
at last
GPT-4o can be used to understand, summarize, and perform basic analysis on data described in natural language. It improves the accessibility and ease of use of data analysis, especially in preliminary research and summarization tasks.
However, GPT-4o should be used as an auxiliary tool, rather than a replacement for traditional data analysis tools, to achieve comprehensive and complex data analysis.